A portfolio of sorts
Just a quick index/reference of stuff I’ve done
Projects
This Portfolio!
| Github |
This portfolio site is automatically built using quarto and deployed to Cloudflare Pages using github actions containers. All linked notebooks are rendered as well as native sub pages, and all PDFs and other linked documents are directly hosted in /assets.
All assets are not directly part of the repo itself, but are downloaded by the cloudflare action using build.sh. This allows me to change and sub project and still have the latest version at any regen, and allows me to have separate github repos for each project.
MinLizHash
| Github |
This is a simple implementation of the MinHash LSH deduplication algorithm. MinHash is an approximation of the Jaccard similarity between two sets. If you treat documents as bags of tokens, you can use this to measure the overlap of two documents. This is very inefficient, and minhash exploits hash colliisions to essentially generate a random variable that is the jaccard similarity in the limit. If you do this process many times with many different hash seeds, it gets quite accurate (central limit theorem is very useful!). LSH is a method for taking these hash signatures and bucketing them with hash bands to make duplication lookup at a large scale orders of magnitude faster (sub O(N)).
Apple Photos DB Explorer
| Github |
Made an electron app that automatically processes the local sqlite database used by Apple Photos to create an interactive visualization of various internal ML metrics used by Apple to categorize/rate your photos. Quality scores, detected age/facial expressions/race/sex/etc, etc. Made with a mix of svelte/electron/observable plot.
Municipal Finance OCR Project
| Github |
Small package I wrote as a Research Assistant to help digitize 800+ page scanned PDFs of municipal bond data from Moody’s Analytics. It’s quite messy and like context-dependent, and I never got a chance to finish it, but I learned a lot. Uses the GCP OCR API in combination with the LayoutParser package and their tablebank model. Eventually I got access to a already digitized one, and used gpt-3 to auto-simplify the human entered categories into a more standardized format. I don’t have that code in front of me though.
College Projects
These are sort of in order, but not precisely.
Bayesian Econometrics Project (Spring 2023)
| Notebook and Writeup | Github |
This was made as a final project for my Bayesian econometrics class. All of the useful info is in the notebook.If any of the comments or anything are confusing, it’s probably because of the target audience (my professor).
TL;DR
- It uses a full count census dataset, so I wouldn’t try to run it. It took a long, long time to run on A100s. I did include a way (and the raw dataset) to run it using just a sample percentage of the dataset, though.
- A lot of the processing is done in duckdb, and I did not include the database in the repo. the full size of is gigantic, far too big for github. I included the cut down samples after processing, though.
- Jupyter could not load a large number of the figures without crashing, so they are all in the /figures directory. the chains of the models are also in .nc form in the /chains directory. I normally dislike jupyter because it is messy like this, but was a project requirement for me.
- There are a lot of comments in the notebook, but I did not include a lot of the code that was used to generate the figures. I did include the code for the figures that were generated in python, though.
Data Structures Projects (Spring 2023)
Github| Project | Description |
|---|---|
| P1 - Sorting Methods | This project compared sorting methods by using the .cover files generated in python. |
| P2 - Double Linked List | Simple implimentation of a doubly linked list. |
| P3 - Deque and Hanoi | Basically is just an extension of double linked list, a deque implimentation, a towers of hanoi implimentationm, and a lot of tests. |
| P4 - AVL Tree | Implimentation of a self balancing AVL Tree, and testing to go with it |
American Economic Mobility (Fall 2022)
Papers and figures from my American Economic Mobility class.
| Github |
Final Project :
A paper on the regional demographic and mobility trends in Virginia. Very similar to the dataset used on the bayesian model above, this is the first paper I used it with. Basically analysis of linked census microdata from 17th century full count decennial censuses. This has been unchanged since it’s creation and I made it rushing last minute before the deadline, so keep that in mind ahah.
| Term Paper | Code (very messy…) |
Dubois Project:
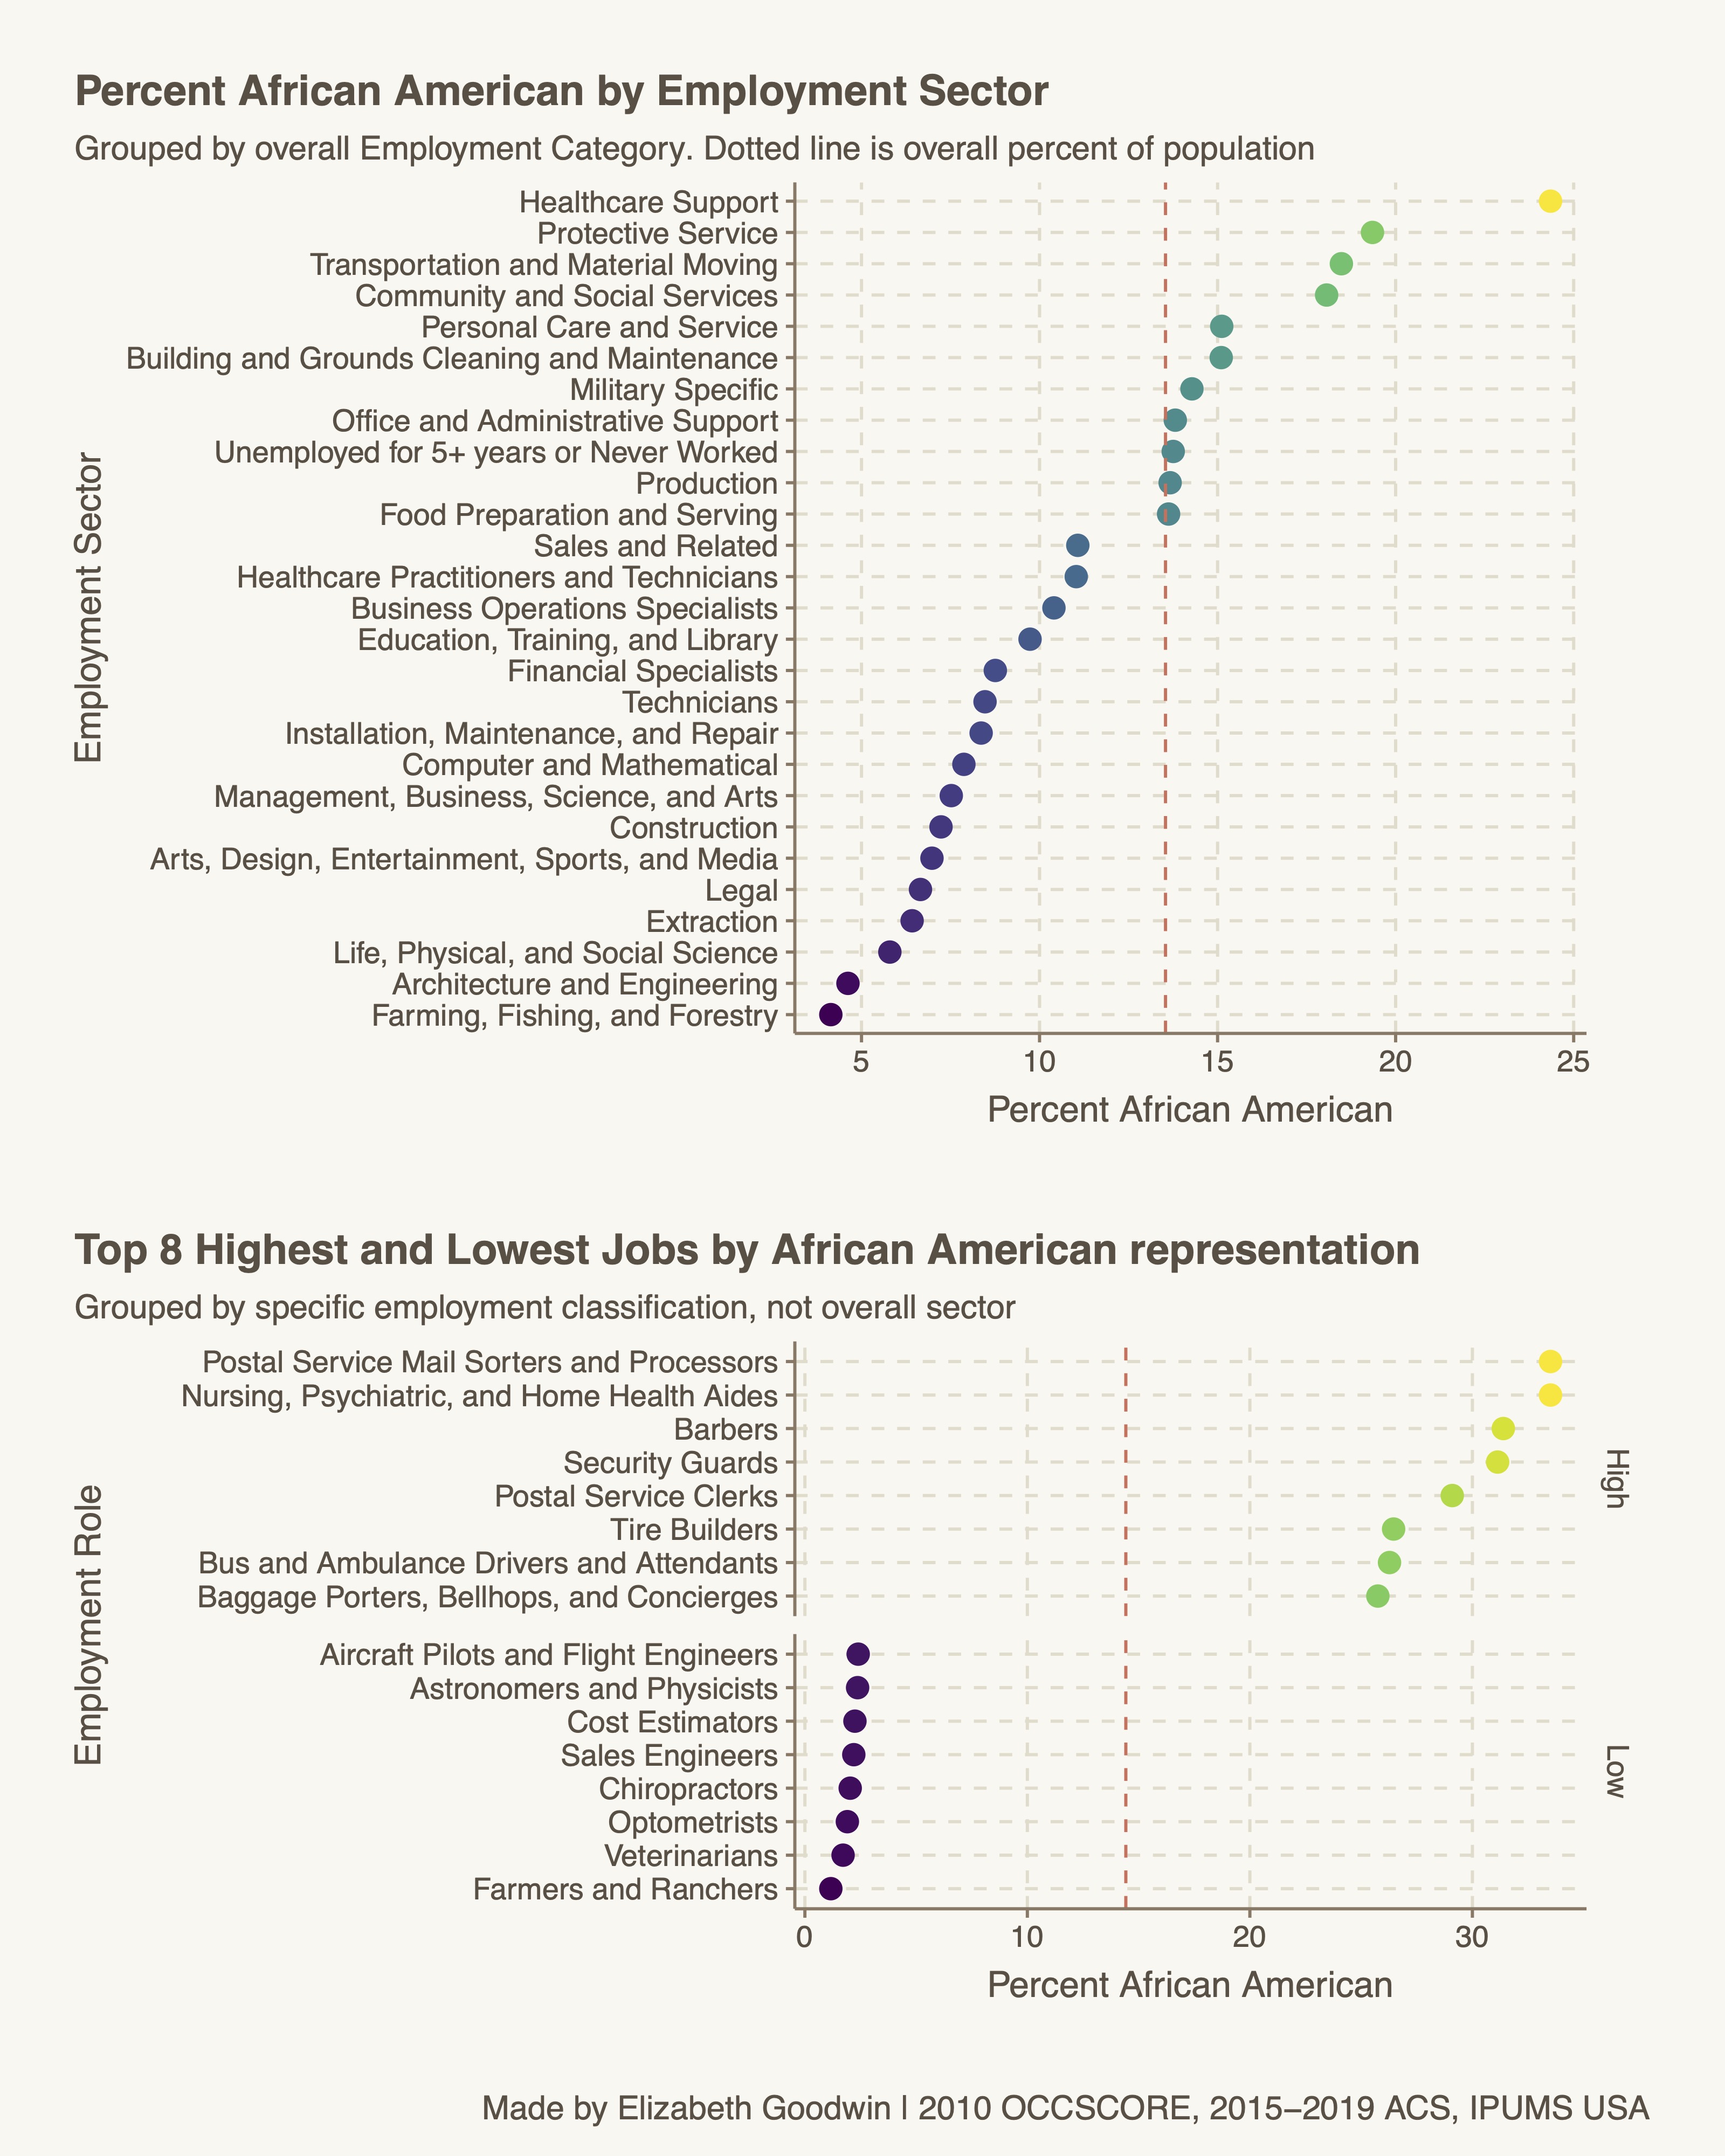
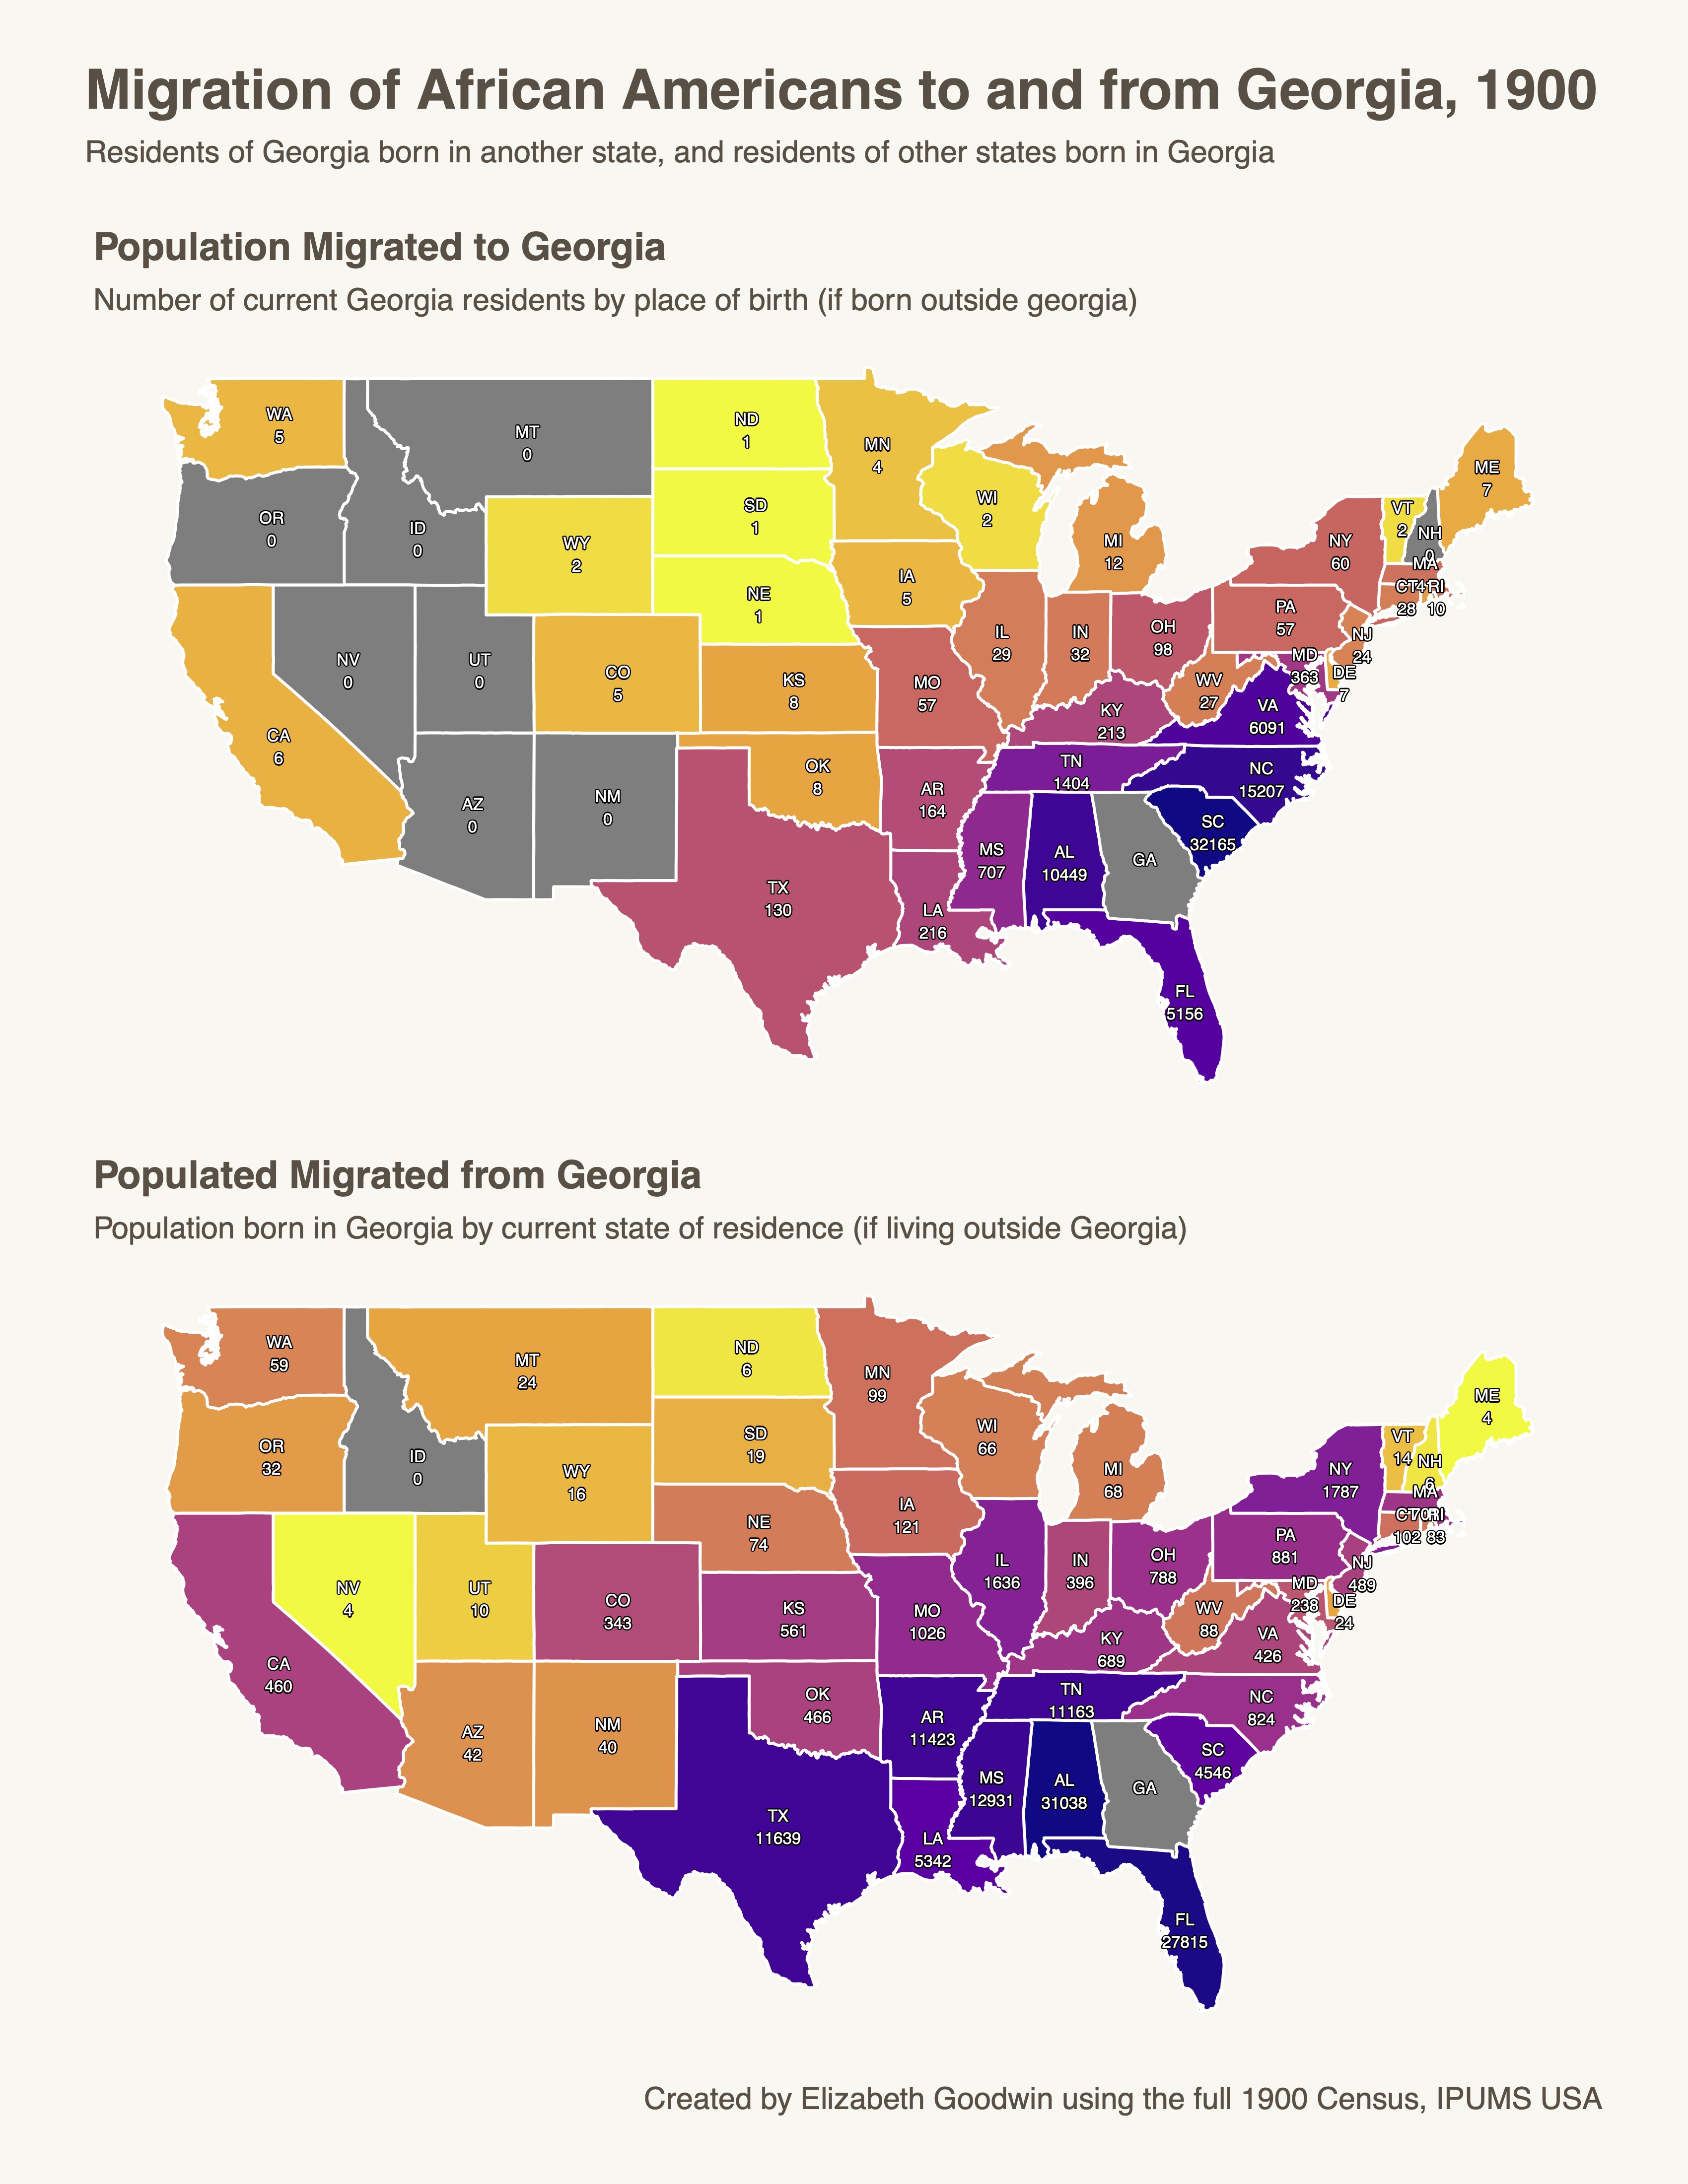
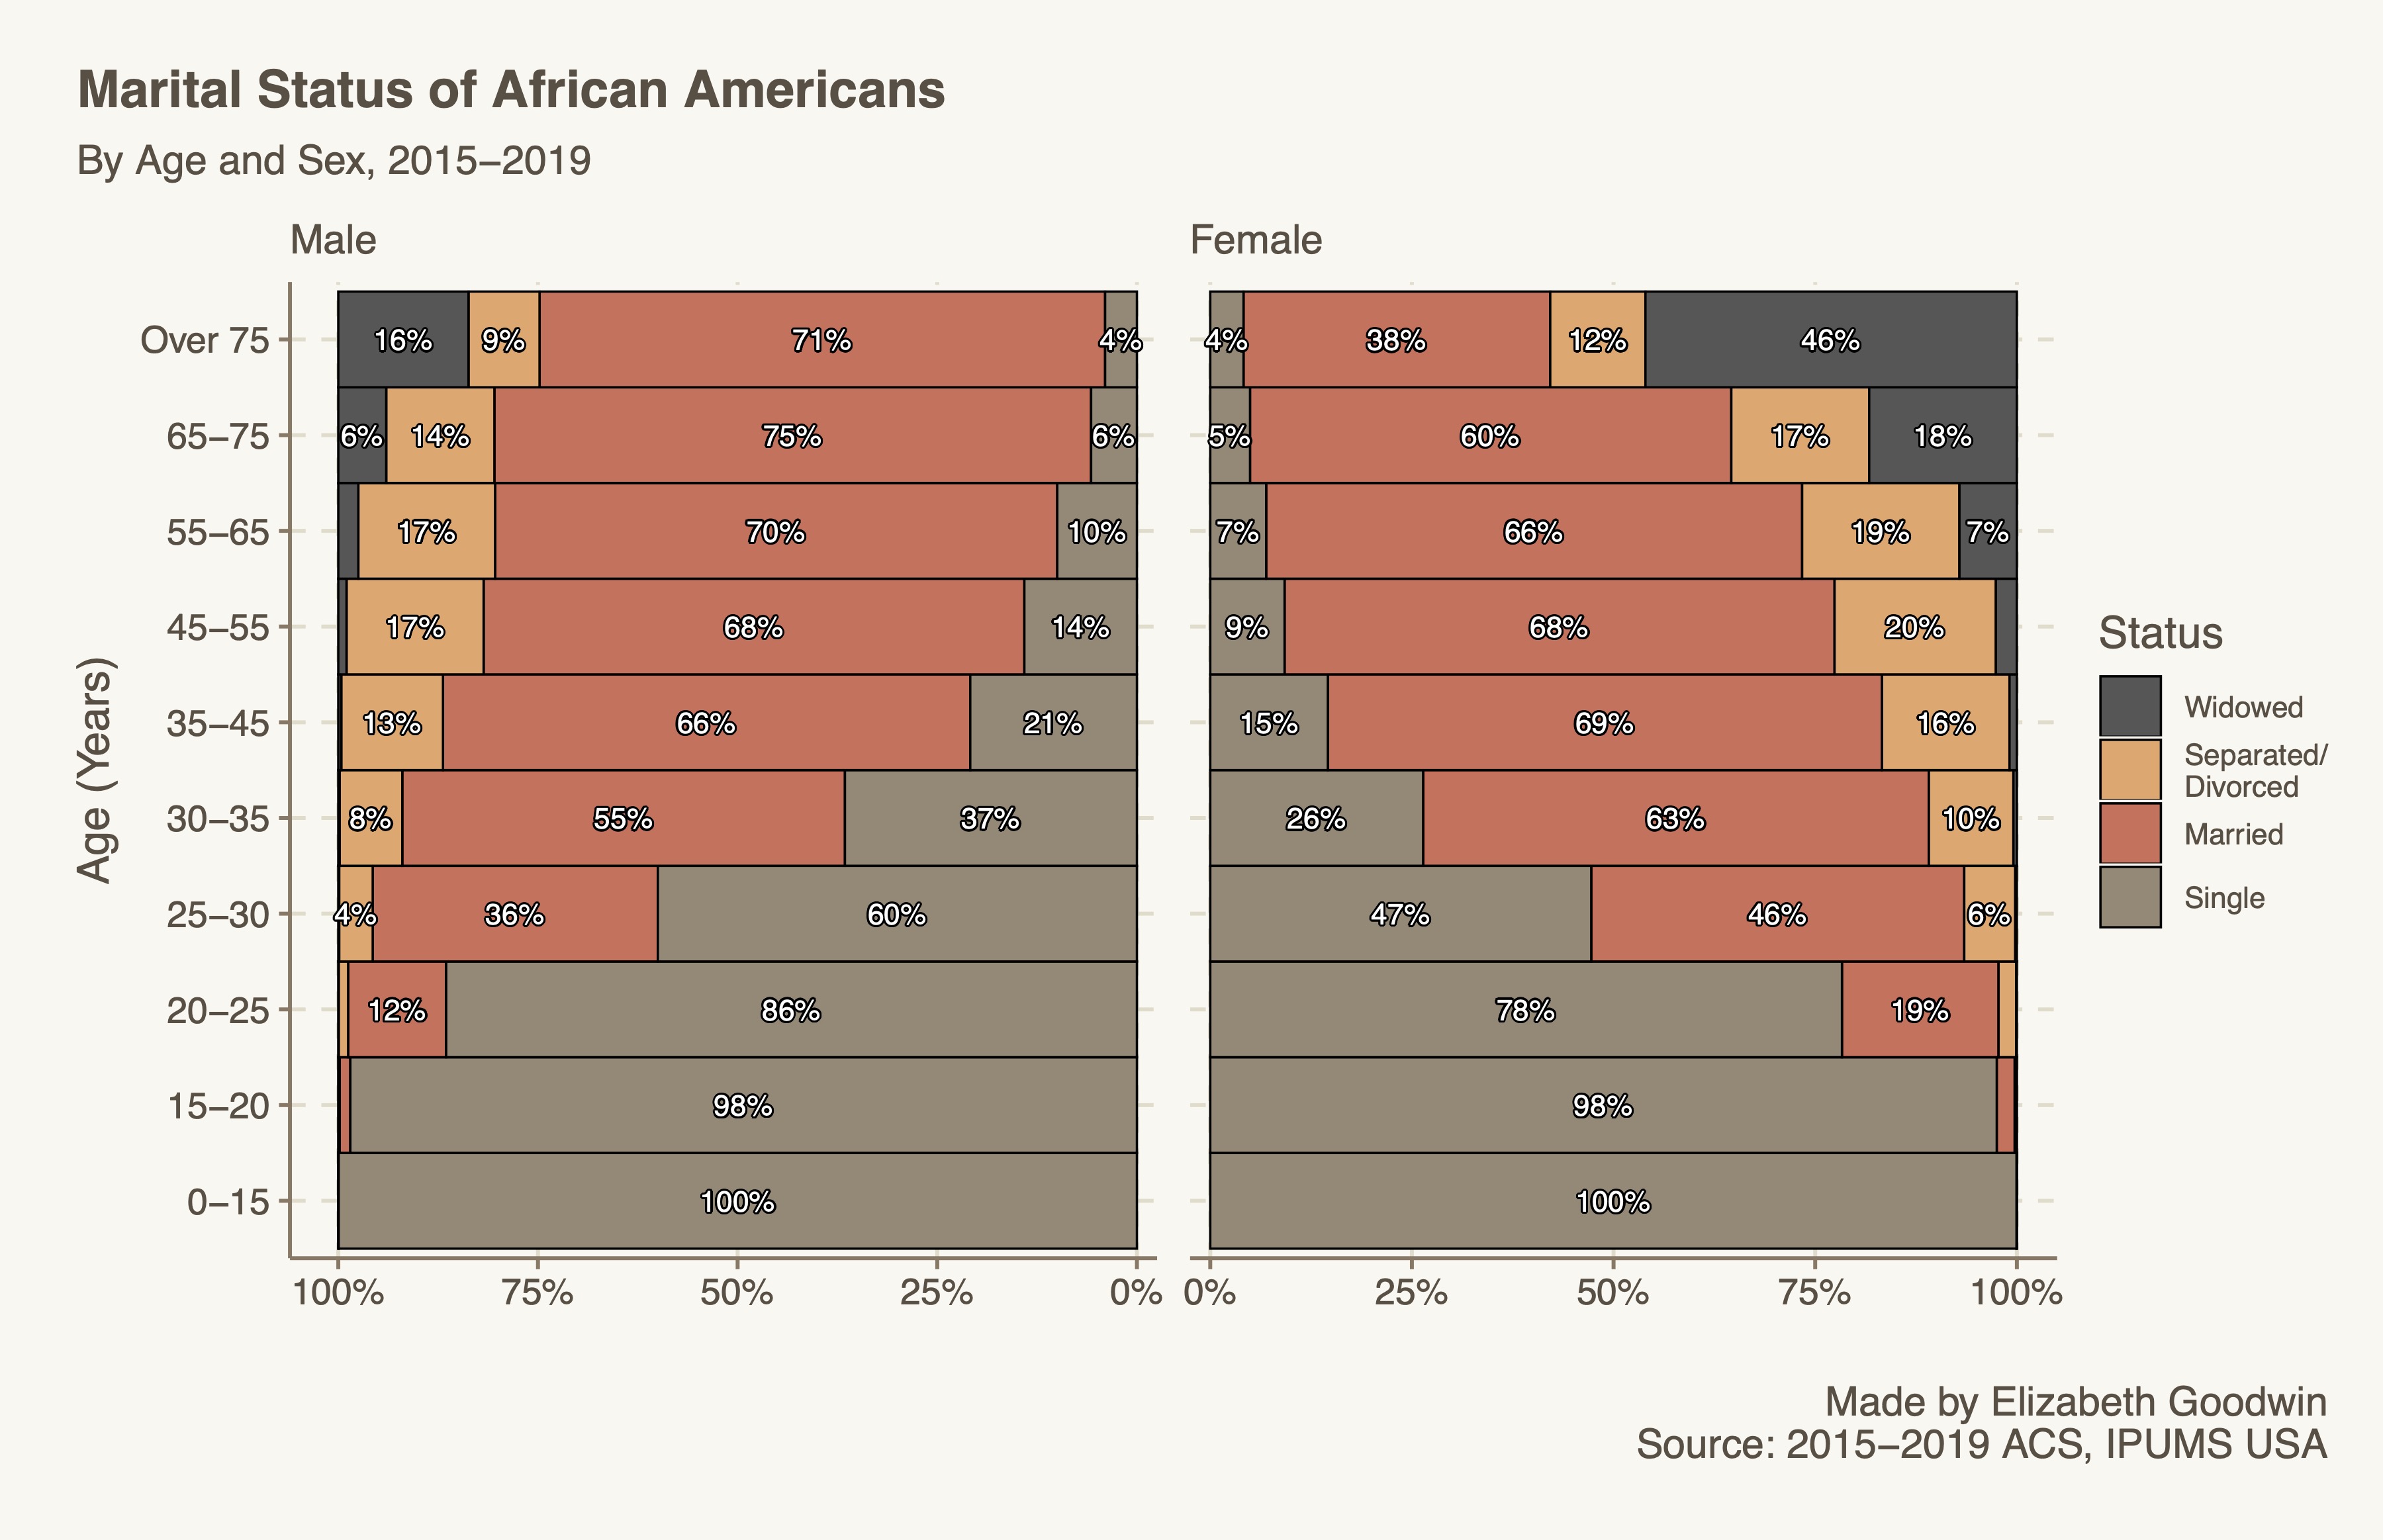
An assignment to recreate our own visualizations based on W.E.B. Dubois’ famous visualizations from the 1900 Paris Exposition. The code used to generate all this can be found here and some notes about it can be found here.
A totally modern graphic I made in the same project.
This recreates it almost exactly but using the full 1900 census instead.
This recreates a population pyramid he made, but this time using modern data.
Experimental Economics (Fall 2022)
Custom Otree Game
| Github | Presentation of findings |
Created a custom otree UI to power an experiment run in my experimental economics class. Whole thing was hosted on heroku.
(Note: this was not normal for the class. I just made my own thing since the software everyone else used was horrible.)
This was technically a group project I frankly I did almost all the work (and all of this part of it for sure).
Also, there was a lot of weird trickery I did with symlinks when making it, so the github repo is a little weird. Basically public_goods/__init.__.py programmatically renders depending on the name of the directory it’s in, which depends on the symlink. So I wrote the stuff once to create multiple games. There are definitely better ways to do this, but I was in a rush and it worked.
Time Series Econometrics (Spring 2022)
| Github |
Super interesting class. Time series/forecasting stuff is fascinating to me. Unfortunately the professor was very old so a lot of stuff was done in…. eviews. I redid as much as I could in R’s tidymodels/fable ecosystem but some stuff wasn’t easily replicable. All are only available in PDF form. Almost all of this is done in R Markdown.
| Description | |
|---|---|
| HW1 | Simple assignment where we basically just redid OLS by hand. It wasn’t supposed to be printed out like this but I wanted practice on my LaTeX skills. |
| Forecasting Project | Was given crime data up to a certain point. Was completely open ended, and your grade was determined by the MAPE of your forecast. |
| VAR Assignment | Extension of the forecasting project but using vector autoregressions. |
| Unit Root Assignment | Assignment to assess if GDP has a unit root or not. Again, old professor so old data ahah. |
| PPP Breakpoint Assignment | Assignment on breakpoint testing using an example of a purchasing power parity GDP time series. |
| DOLS Assignment | Assignment on using DOLS. All done in eviews. |
| Money Demand in the US | Focusing on similar problem to breakpoint and Unit Root ones, but on money demand on the US and elasticities to inflation/interest rates. iirc this replicated some Friedman paper. |
| Money Demand in the UK | Essentially same this as before, but for the UK. Uses some more advanced Time Series techniques. |
| Term Paper - Seattle Bridge Closure | Term paper/project for the class. I did this on a fixed effects model trying to use the closure of the Seattle Bridge for several years as a natural experiment to measure the effect of transit times on housing values. Causality was very messy (esp as home values are forward looking…) but was pretty interesting to investigate nonetheless. |
Econometrics (Fall 2021)
Easily my favorite class I have ever taken, made me fall in love with econ/stats. Unfortunately, I didn’t keep track of all the files that well. They are also spread between stata, R, and python. Everything was assigned in stata, but I redid most of the assignments in R or Python to learn them better.
Anyways, here is what I have:
Assignment 2 Problem set on various datasets. All done in python (note: I was very bad at python back then).
| Main Notebook | Secondary Notebook | Instructions | Github |
| Writeup, code, and figures (pdf) | Instructions | Github |
| Writeup | Instructions | Code |
| Writeup | Instructions | Github | Code |
Final Exam I just did my final exam in R markdown and LaTeX instead of by hand as it was a remote thing. Everyone else did by hand for the most part. Don’t have access to the exam itself anymore. I also got the highest grade in the class.
| Final Exam Writeup | Github | Code |
Intermediate Macroeconomics (Fall 2021)
| Code | Description | |
|---|---|---|
| Assignment 1 | Code | Graphed and wrote up some inflation figures in python. |
| Assignment 2 | Code | Graphed T-bill and GDP forecasting data in python, also includes writeup. |
| Assignment 3 | Code | This was first ‘data project’. had to answer a bunch of data related questions about GDP data by looking into the details of the data. All done in R/R markdown. |
| Assignment 4 | Code | Problem set. I don’t have the original problems but I copied all the written ones in the PDF. All done in R markdown. Includes a bunch of custom LaTeX graphics (not part of the assignment, I was just showing off lol) |
| Assignment 5 | Code | Another, different problem set. Answered a bunch of theoretical macro questions and made a bunch of latex graphics. All in R markdown. |
Note:
None of these projects were intended to involve actual programming and were supposed to be done in excel. I just intentionally replicated everything in a mix of R and Python so I could learn R/Python better. As this was much more of a first learning experience, this is from when I was very inexperienced and please take any bad code with grain of salt. I had only lightly used python before this class, and had never in my life used R before. Also did a lot of LaTeX graphics and equations, as most of the non-graph related assignments were intended to be done by hand (I wanted to show off).